


Relatórios da empresa

    {
    "type": "line",
    "data": {
        "labels": [
            "Janeiro",
            "Fevereiro",
            "Marchar",
            "Abril",
            "Maio",
            "Junho",
            "Julho",
            "Agosto",
            "Setembro",
            "Outubro",
            "Novembro",
            "Dezembro"
        ],
        "datasets": [
            {
                "barPercentage": 0.9,
                "borderWidth": 3,
                "label": "Retorno m\u00e9dio do investidor para 2025 em percentagem (%)",
                "lineTension": 0.4,
                "type": "bar",
                "data": [
                    1.7,
                    0.8,
                    1.1,
                    1.7,
                    2.8,
                    2.1,
                    2.3,
                    2,
                    1.4,
                    3.2,
                    1.8,
                    2.3
                ]
            }
        ]
    },
    "debug": true,
    "options": {
        "indexAxis": "x",
        "maintainAspectRatio": false,
        "scales": {
            "y": {
                "position": "left",
                "ticks": {
                    "font": {
                        "family": "'Helvetica Neue', 'Helvetica', 'Arial', sans-serif",
                        "size": 12
                    }
                },
                "title": {
                    "display": true,
                    "font": []
                }
            },
            "x": {
                "position": "bottom",
                "ticks": {
                    "font": {
                        "family": "'Helvetica Neue', 'Helvetica', 'Arial', sans-serif",
                        "size": 12
                    }
                },
                "title": {
                    "display": true,
                    "font": []
                }
            }
        },
        "plugins": {
            "title": {
                "display": true,
                "font": {
                    "family": "'Helvetica Neue', 'Helvetica', 'Arial', sans-serif",
                    "size": 12
                }
            },
            "subtitle": {
                "display": true,
                "font": {
                    "family": "'Helvetica Neue', 'Helvetica', 'Arial', sans-serif",
                    "size": 12
                }
            },
            "legend": {
                "align": "center",
                "position": "top"
            },
            "deferred": {
                "yOffset": "30%",
                "delay": 500
            }
        },
        "animation": {
            "enabled": true
        }
    }
}
    {
    "type": "line",
    "data": {
        "labels": [
            "Janeiro",
            "Fevereiro",
            "Marchar",
            "Abril",
            "Maio",
            "Junho",
            "Julho",
            "Agosto",
            "Setembro",
            "Outubro",
            "Novembro",
            "Dezembro"
        ],
        "datasets": [
            {
                "barPercentage": 0.9,
                "borderWidth": 3,
                "label": "Retorno m\u00e9dio do investidor para 2024 em percentagem (%)",
                "lineTension": 0.4,
                "type": "bar",
                "data": [
                    2.2,
                    2,
                    2.5,
                    1.1,
                    1.2,
                    2.1,
                    2.3,
                    2.6,
                    2.7,
                    1.6,
                    2.9,
                    2.3
                ]
            }
        ]
    },
    "debug": true,
    "options": {
        "indexAxis": "x",
        "maintainAspectRatio": false,
        "scales": {
            "y": {
                "position": "left",
                "ticks": {
                    "font": {
                        "family": "'Helvetica Neue', 'Helvetica', 'Arial', sans-serif",
                        "size": 12
                    }
                },
                "title": {
                    "display": true,
                    "font": []
                }
            },
            "x": {
                "position": "bottom",
                "ticks": {
                    "font": {
                        "family": "'Helvetica Neue', 'Helvetica', 'Arial', sans-serif",
                        "size": 12
                    }
                },
                "title": {
                    "display": true,
                    "font": []
                }
            }
        },
        "plugins": {
            "title": {
                "display": true,
                "font": {
                    "family": "'Helvetica Neue', 'Helvetica', 'Arial', sans-serif",
                    "size": 12
                }
            },
            "subtitle": {
                "display": true,
                "font": {
                    "family": "'Helvetica Neue', 'Helvetica', 'Arial', sans-serif",
                    "size": 12
                }
            },
            "legend": {
                "align": "center",
                "position": "top"
            },
            "deferred": {
                "yOffset": "30%",
                "delay": 500
            }
        },
        "animation": {
            "enabled": true
        }
    }
}
    {
    "type": "line",
    "data": {
        "labels": [
            "Janeiro",
            "Fevereiro",
            "Marchar",
            "Abril",
            "Maio",
            "Junho",
            "Julho",
            "Agosto",
            "Setembro",
            "Outubro",
            "Novembro",
            "Dezembro"
        ],
        "datasets": [
            {
                "barPercentage": 0.9,
                "borderWidth": 3,
                "label": "Retorno m\u00e9dio do investidor para 2023 em percentagem (%)",
                "lineTension": 0.4,
                "type": "bar",
                "data": [
                    2.1,
                    -0.5,
                    2.4,
                    2.7,
                    2.2,
                    1.1,
                    3.3,
                    2.1,
                    1.5,
                    2.1,
                    3.8,
                    2.3
                ]
            }
        ]
    },
    "debug": true,
    "options": {
        "indexAxis": "x",
        "maintainAspectRatio": false,
        "scales": {
            "y": {
                "position": "left",
                "ticks": {
                    "font": {
                        "family": "'Helvetica Neue', 'Helvetica', 'Arial', sans-serif",
                        "size": 12
                    }
                },
                "title": {
                    "display": true,
                    "font": []
                }
            },
            "x": {
                "position": "bottom",
                "ticks": {
                    "font": {
                        "family": "'Helvetica Neue', 'Helvetica', 'Arial', sans-serif",
                        "size": 12
                    }
                },
                "title": {
                    "display": true,
                    "font": []
                }
            }
        },
        "plugins": {
            "title": {
                "display": true,
                "font": {
                    "family": "'Helvetica Neue', 'Helvetica', 'Arial', sans-serif",
                    "size": 12
                }
            },
            "subtitle": {
                "display": true,
                "font": {
                    "family": "'Helvetica Neue', 'Helvetica', 'Arial', sans-serif",
                    "size": 12
                }
            },
            "legend": {
                "align": "center",
                "position": "top"
            },
            "deferred": {
                "yOffset": "30%",
                "delay": 500
            }
        },
        "animation": {
            "enabled": true
        }
    }
}
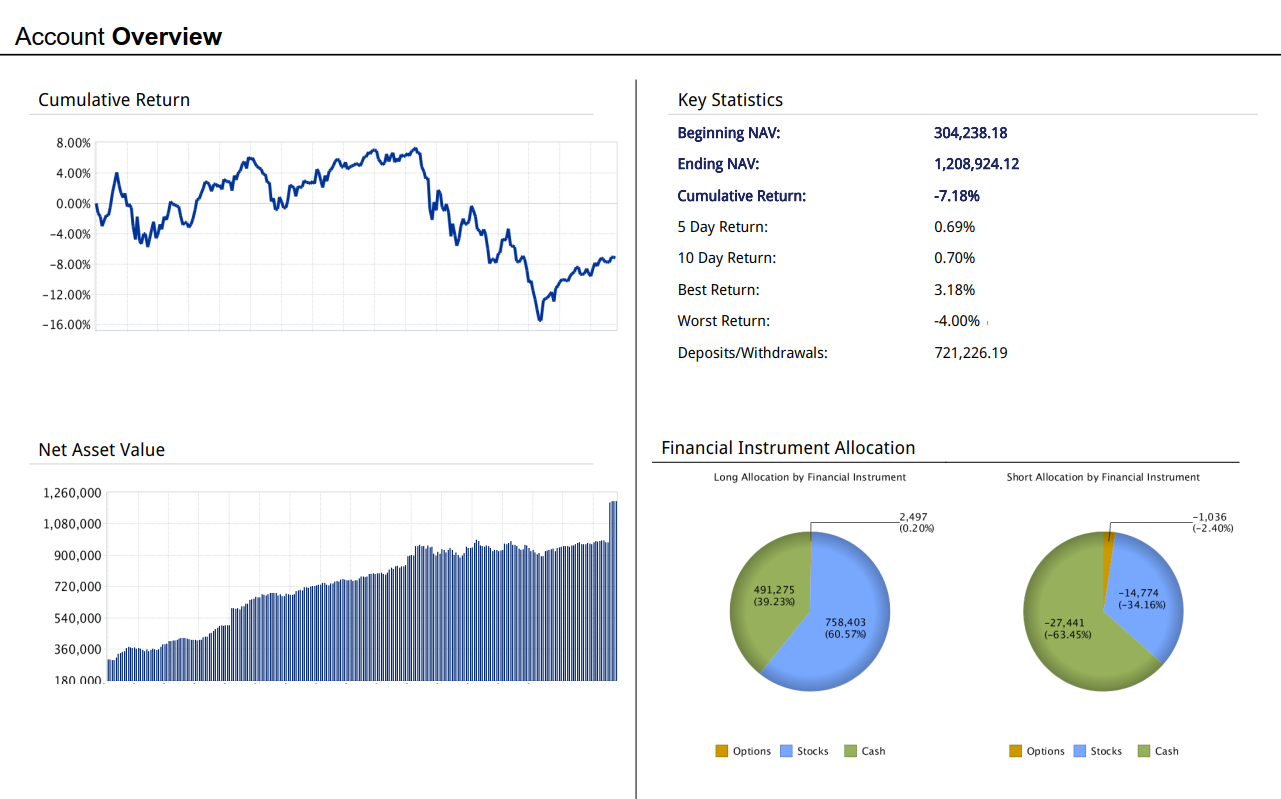
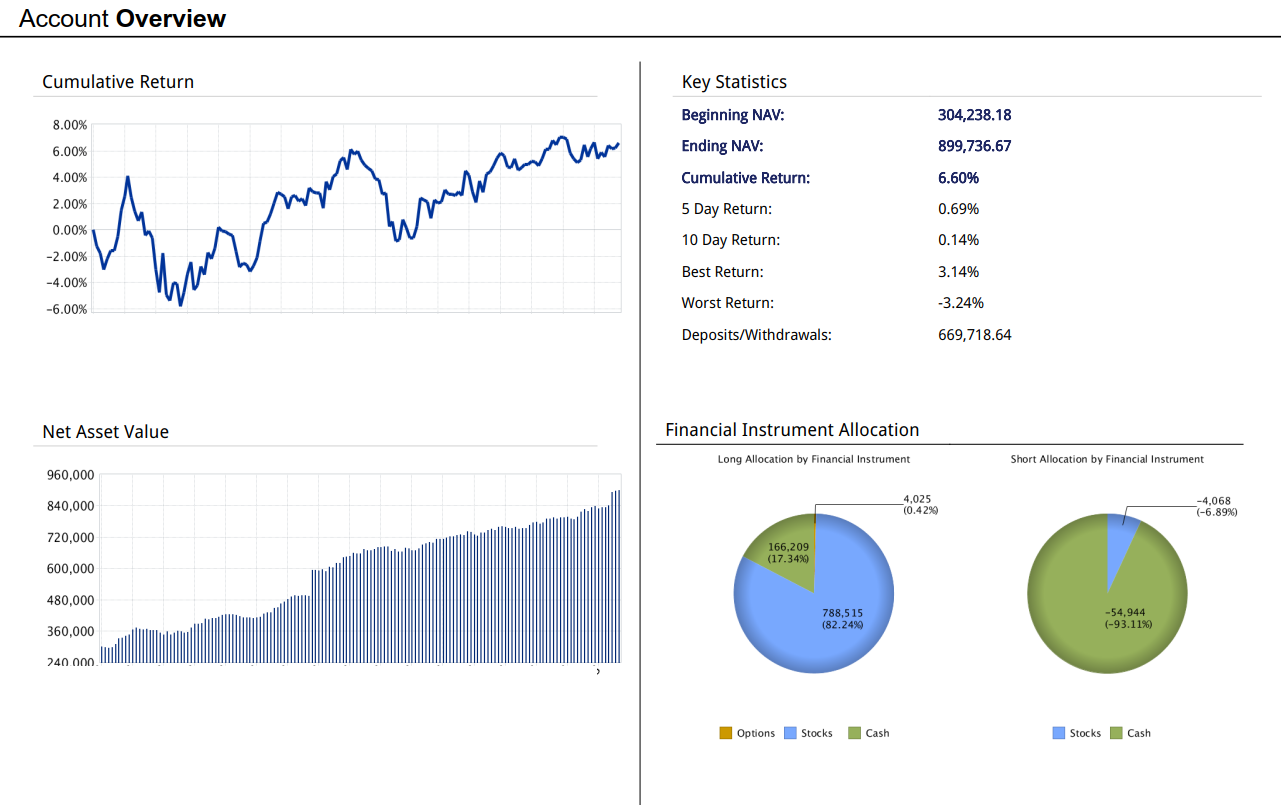
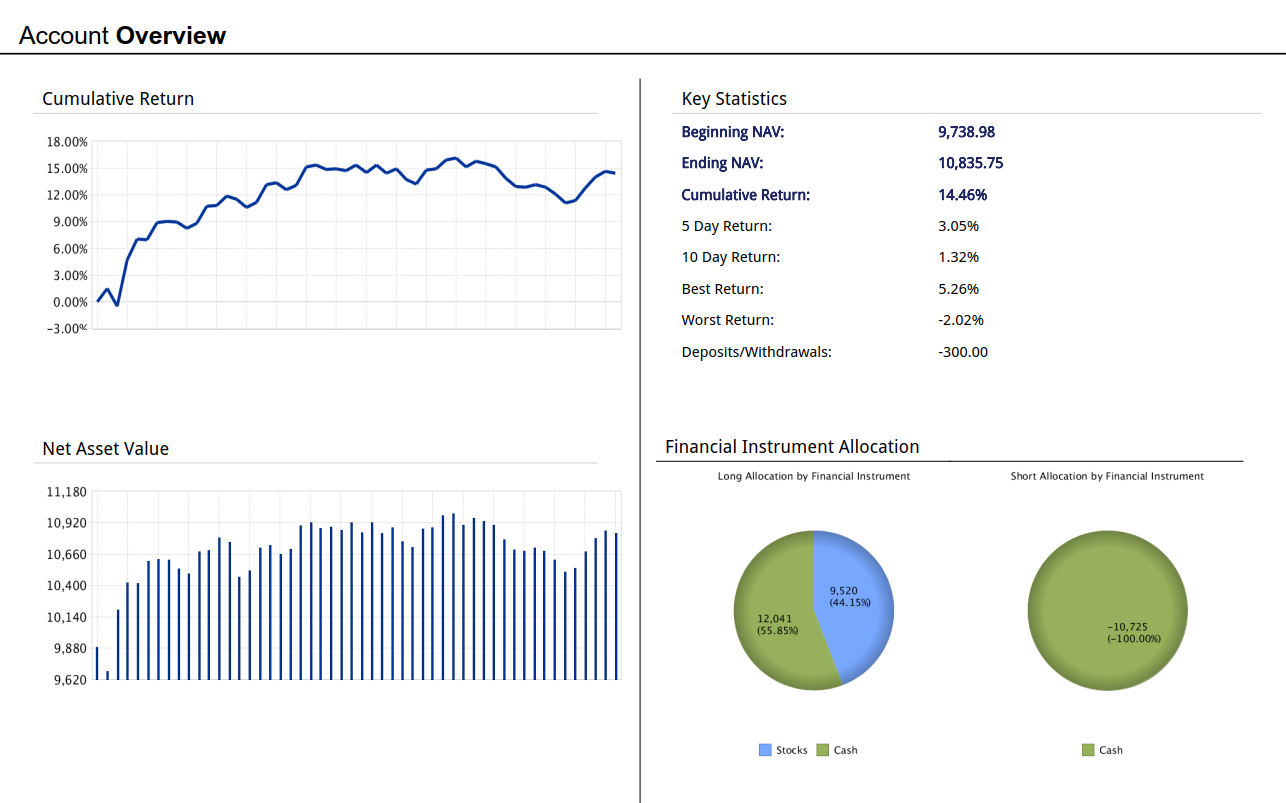
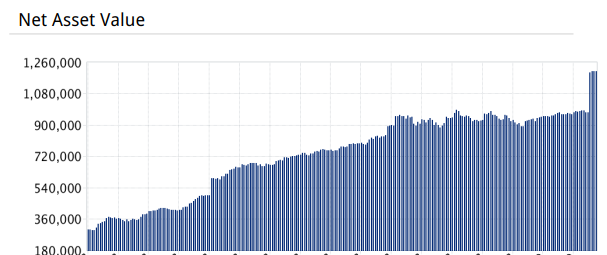
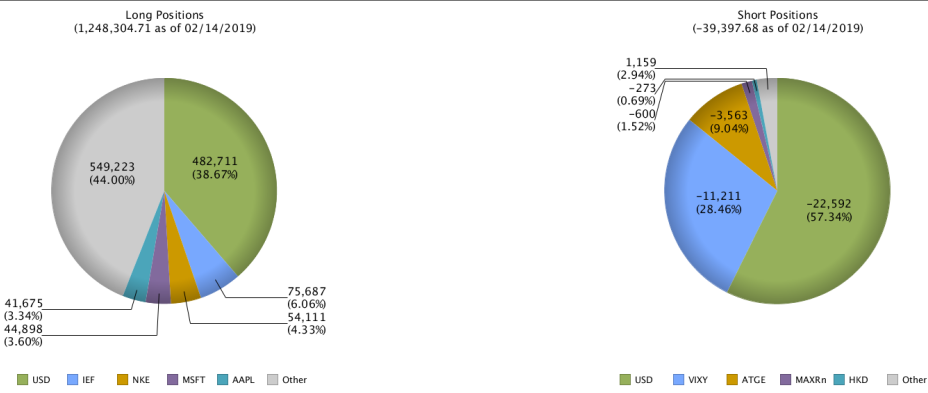
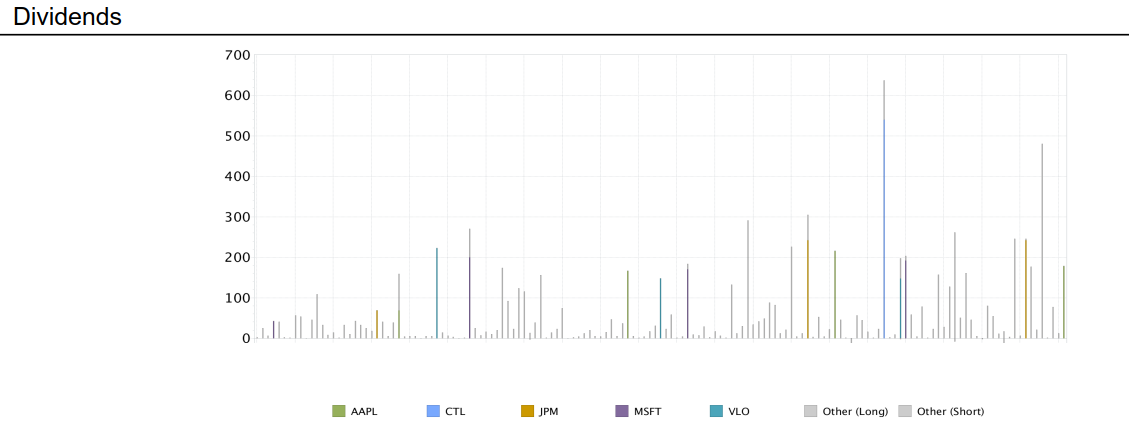
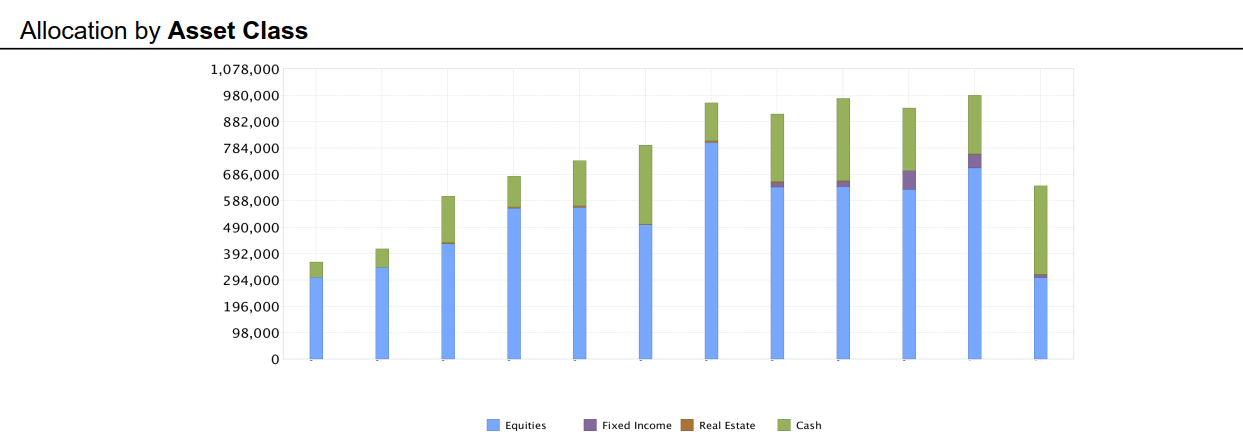
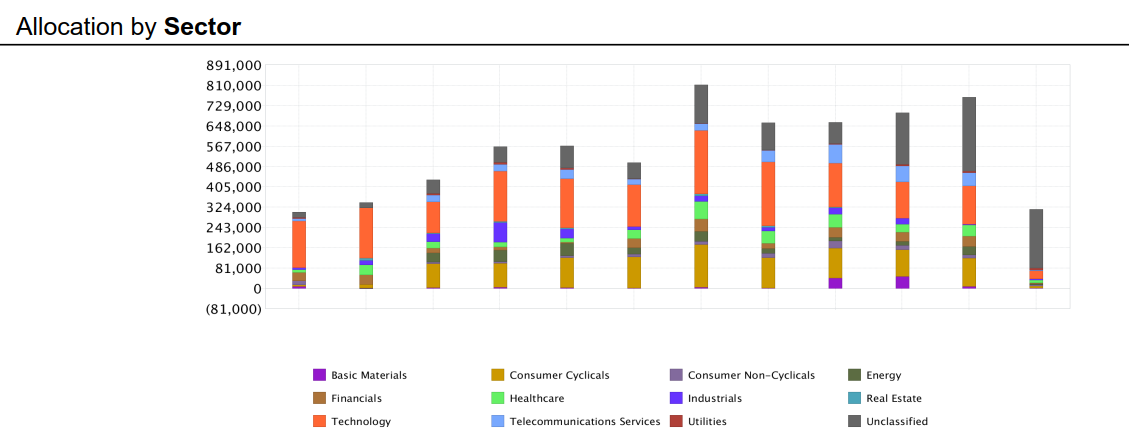
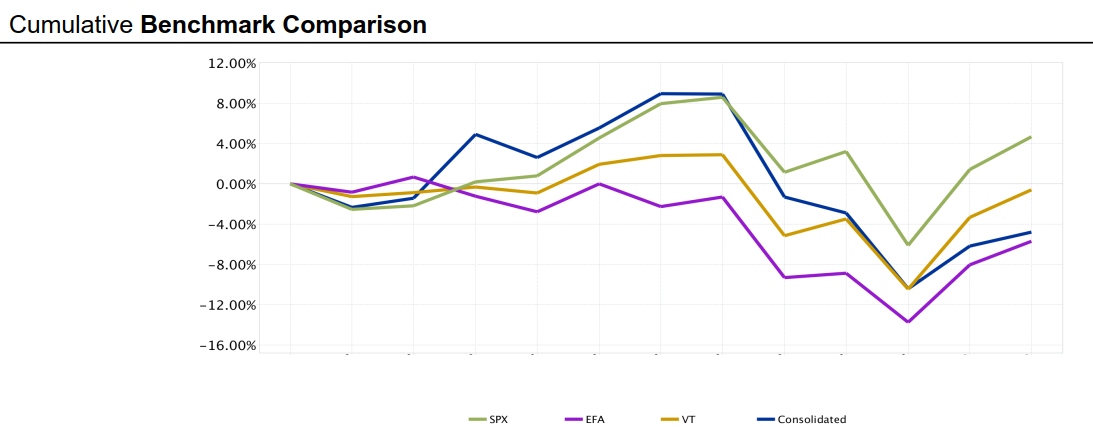
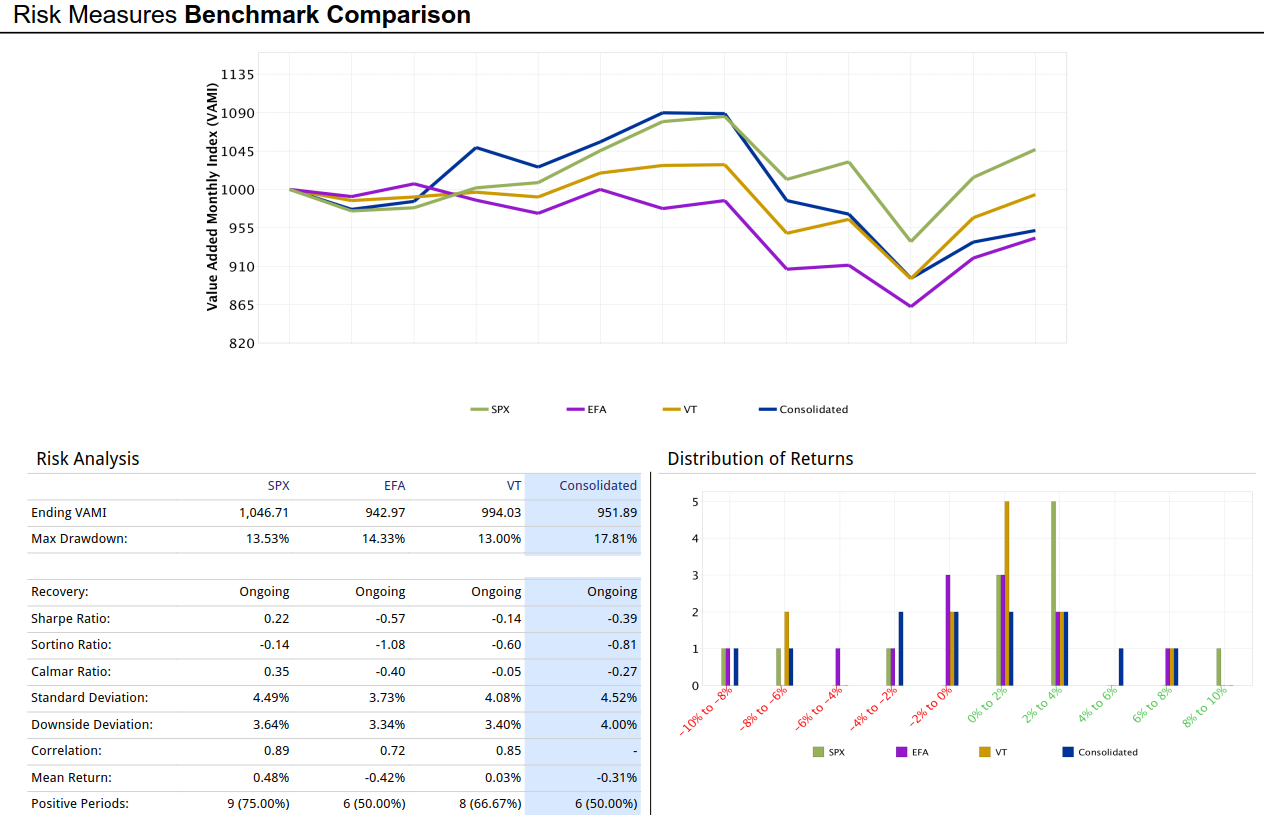
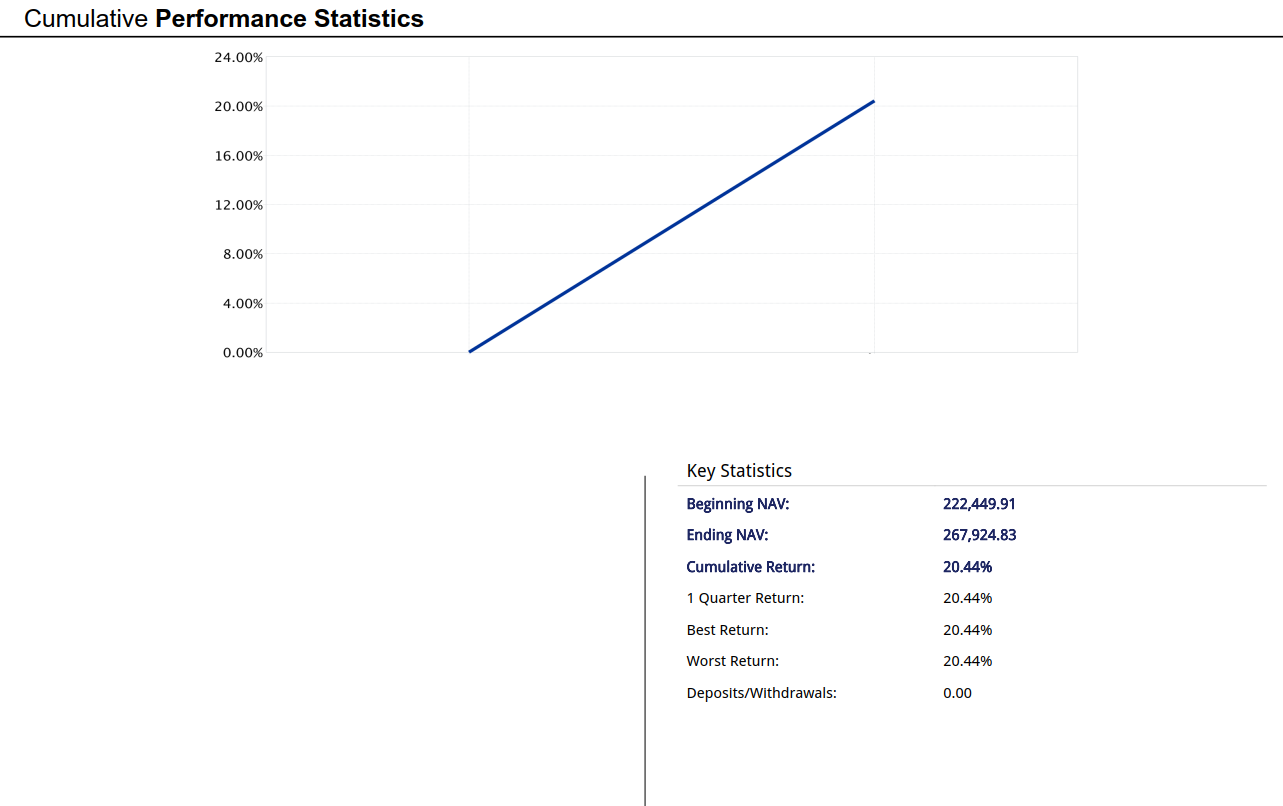
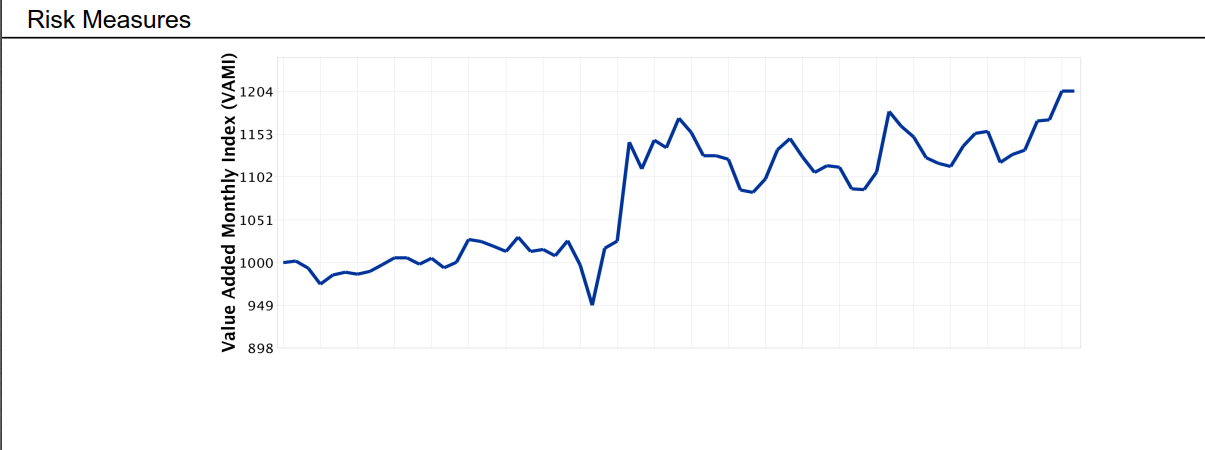
Em conformidade com a política de privacidade de nossa empresa e estrita observância do sigilo do investidor, não podemos fornecer relatórios comerciais completos. Os relatórios completos contêm informações pessoais de clientes - nomes e sobrenomes, números de contas e essas informações são confidenciais. Todos os relatórios de negociação são obtidos de contas ativas e são apenas para fins informativos.
Exemplo de relatórios de negociação de contas ao vivo de nossos investidores
















Relatórios de negociação